
Responsive Design + Map + Open Data
311 DATA: Improving Gov’t Data Visualization
Challenge:
Improve the web-based 311 Data Tool to enhance the user experience and increase user access with a responsive design.
Solution:
Improve the web-based 311 Data Tool to enhance the user experience and increase user access with a responsive design.
Summary:
In order to improve the 311 Data Tool, a web-based analytics product, we analyzed historical data, reviewed user interactions via hotjar, and conducted user testing to understand and define the problems we were designing for. The resulting design solutions were an outcome of collaborating with the product and developer teams to brainstorm and produce an initial low fidelity mockup. The final high fidelity desktop and mobile prototype were derived from an iterative design process that focused on user needs and feedback from everyone on the team.
Background:
Hack for LA, in collaboration with Empower LA, created 311 Data - a web-based tool for Los Angeles Neighborhood Councils and residents to visually explore and analyze publicly available 311 data.
Neighborhood Councils are grassroots-level advisory bodies that exist to connect residents to City Hall.
311 Data is reported non-emergency issues a city receives that include potholes in the road, trees down, graffiti, and trash problems. It is utilized by the community to help bring awareness to non-emergency issues and make sure authorities are aware that they exist.
At its core, the 311 Data tool allows users to:
Search through open geospatial data based on date ranges, council districts, and 311 request types
Compare two different data queries
Visualize and interact with search results cartographically and with charts and graphs
Export search query resultsSolution:
Improve the web-based 311 Data Tool to enhance the user experience and increase user access with a responsive design.

The original 311 Data website - Map and Data Visualizer
Challenge:
For the next feature release, the UX team was tasked with designing an update to the interactive map and creating designs that were mobile compatible. This included leveraging all available data to make these new iterations incorporate improvements to the user experience.

311 Data roadmap document
Discover:
To begin defining our problem(s), we went back to our users. Observing and documenting, we aimed to understand their preferences and problems. We even made sure to revisit our initial personas to remind ourselves who our end users were and if we needed to iterate on these original assumptions based on new research.


311 User Personas
Site Analytics:
Research began with exploring web analytics using Mixpanel. Several months of historical data revealed to the team that:
Users were dropping off the site after using the 311 Data tool
We had a low conversion rate of users using the compare feature
While using the Data Tool, users would input information but not run data search queries
There were a number of users attempting to use the web-based tool using a mobile device

View of site analytics on Mixpanel
Reviewing User Interactions
Research began with exploring web analytics using Mixpanel. Several months of historical data revealed to the team that:
Users were dropping off the site after using the 311 Data tool
We had a low conversion rate of users using the compare feature
While using the Data Tool, users would input information but not run data search queries
There were a number of users attempting to use the web-based tool using a mobile device


View of hotjar videos and observations
Defining our problem:
Research trends revealed that we had many more problems than we assumed initially. We came to understand that:
Non-tech savvy users were having difficulty using the Data Tool
The compare feature was not being used
Users wanted to find their neighborhood council before they explored data
Users wanted to use the data tool on their mobile device
Users wanted a more responsive Data Tool that provided immediate feedback when inputting data queries
These observations were used to define our design challenges below.
How might we create a more responsive site?
How might we create a more responsive site?
How might we make the 311 Data Tool easier to use?
How might we make the 311 Data Tool easier to use?
How might we combine the compare feature with the Data Tool?
How might we combine the compare feature with the Data Tool?
Brainstorming
Collaborating with product management and developers, we crafted solutions to our problems. These solutions included:
Simplifying the data tool interface to limit the number of available features for “basic users”
Provide a way for users to find their neighborhood or city council based off their address
Combine the basic and advanced features into one tool
Remove the “submit” button to provide a seamless data search
Set default inputs for the basic and advance feature
Provide users more flexibility with changing the visual interface of the map
We also did a low-fidelity mockup of what a simplified Data Tool could look like. We envisioned an address locator that allowed users to discover their neighborhood and a "advanced" features toggle to provide a way for us to combine the Data Tool and the compare feature. We also initially felt that a pie chart would be a nice visual for users in lieu of a legend.
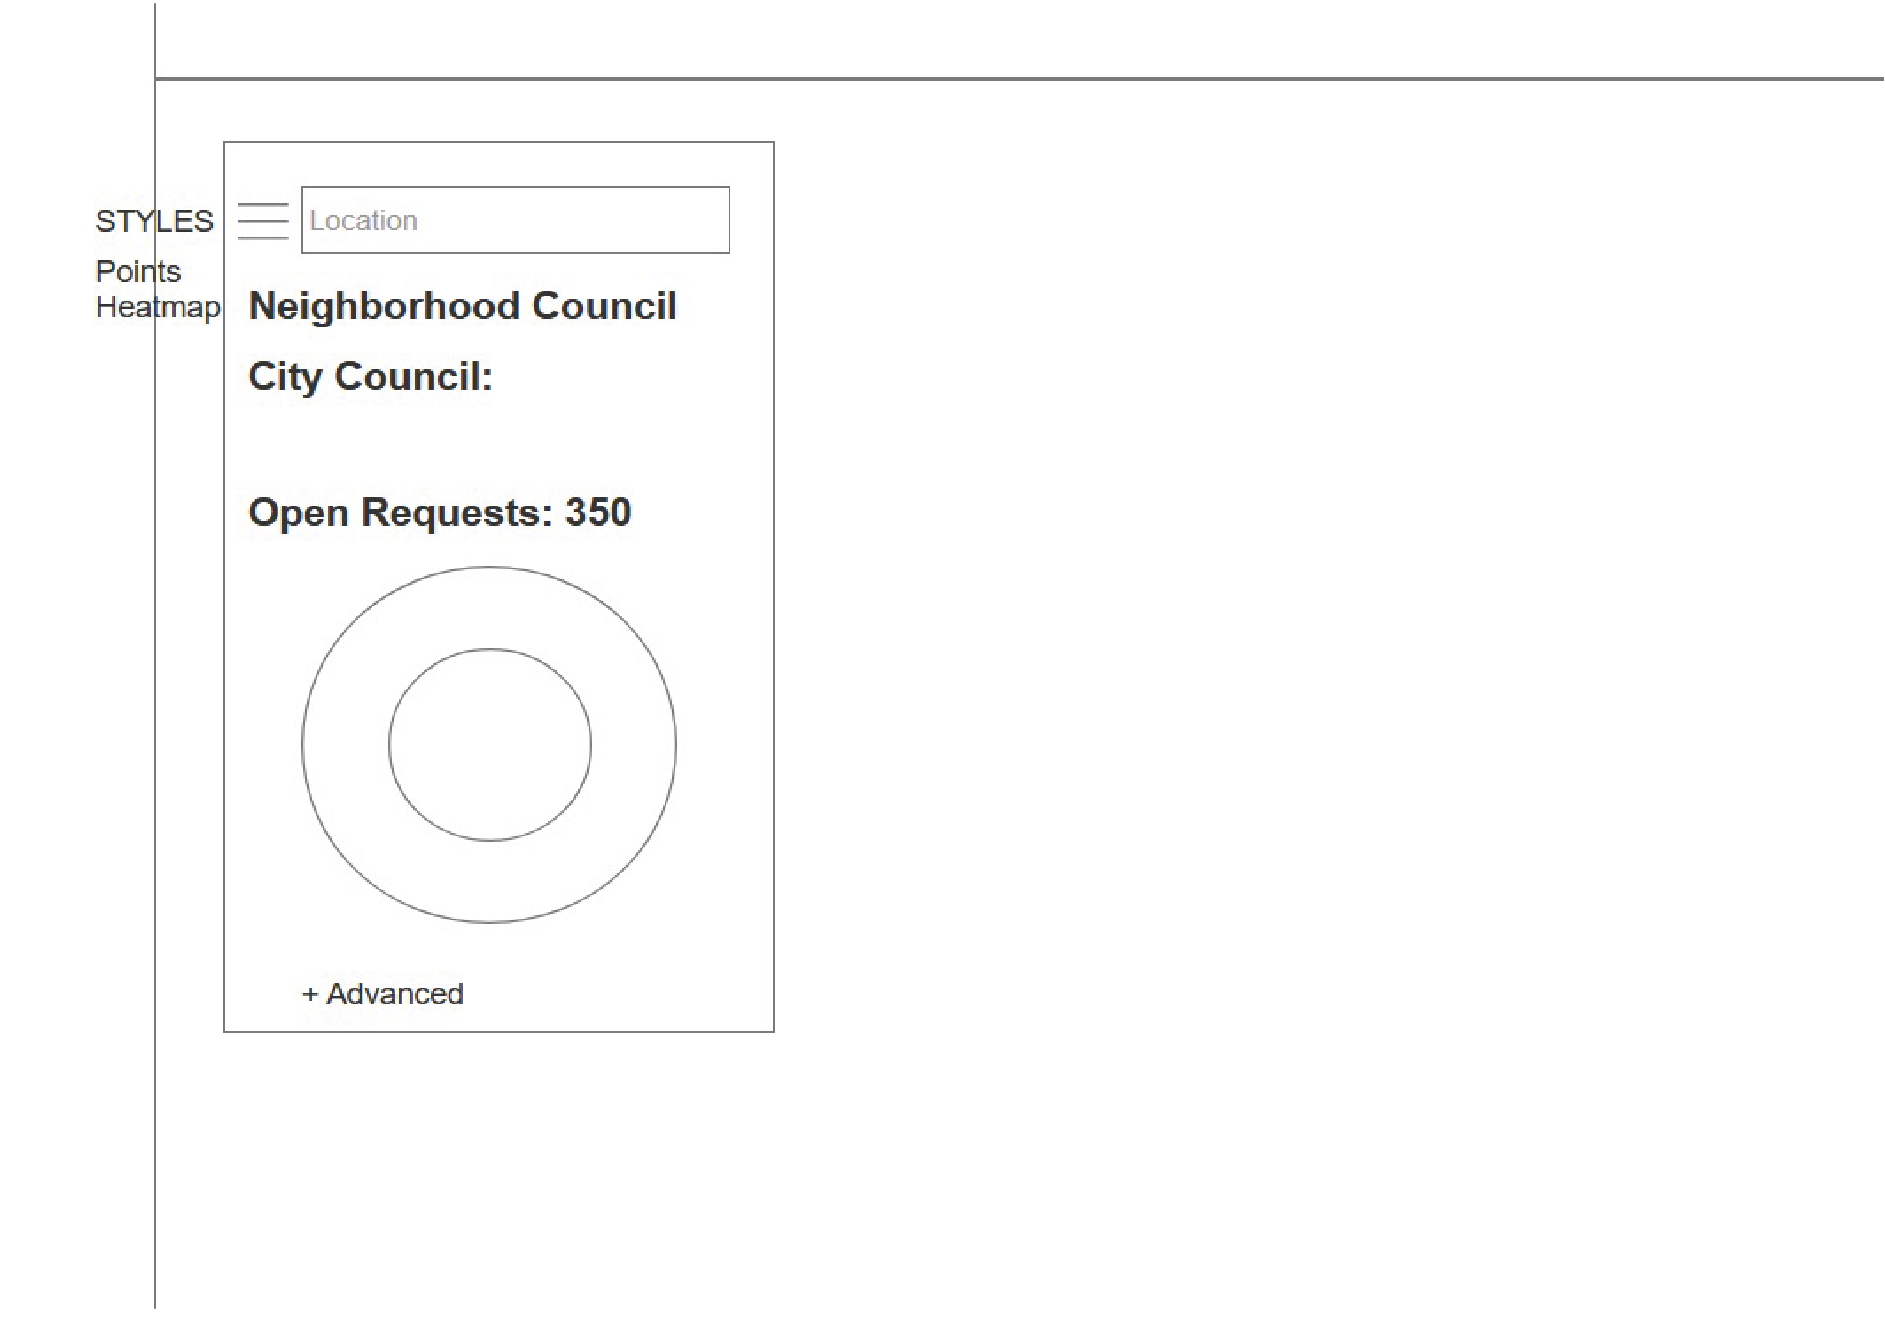

Lo-Fi and Hi-Fi mockups
Iterations:
From the design studio, it took a number of iterations for us to finally land on a design that received buy-in from management and developers.

311 data tool desktop redesign iterations
Final Design: Old vs. New
As can be seen below, the redesign was a significant departure from the original Data Tool. After learning that basic users were less tech-savy then our original assumption, we refined the amount of features available on the initial start of the tool to decrease cognitive overload. This included providing users only one input field in which they can either type their address to find a neighborhood council or search for specific council district. This also substantially reduces the amount of data users have to input to initially use the tool. We also allowed default geospatial data to be shown the moment the Tool is accessed and a collapsable filter bar for users to engage with and refine the data that is presented to them without having to push a "submit" button. Finally, we included a map setting option for users to adjust visual elements of the map.

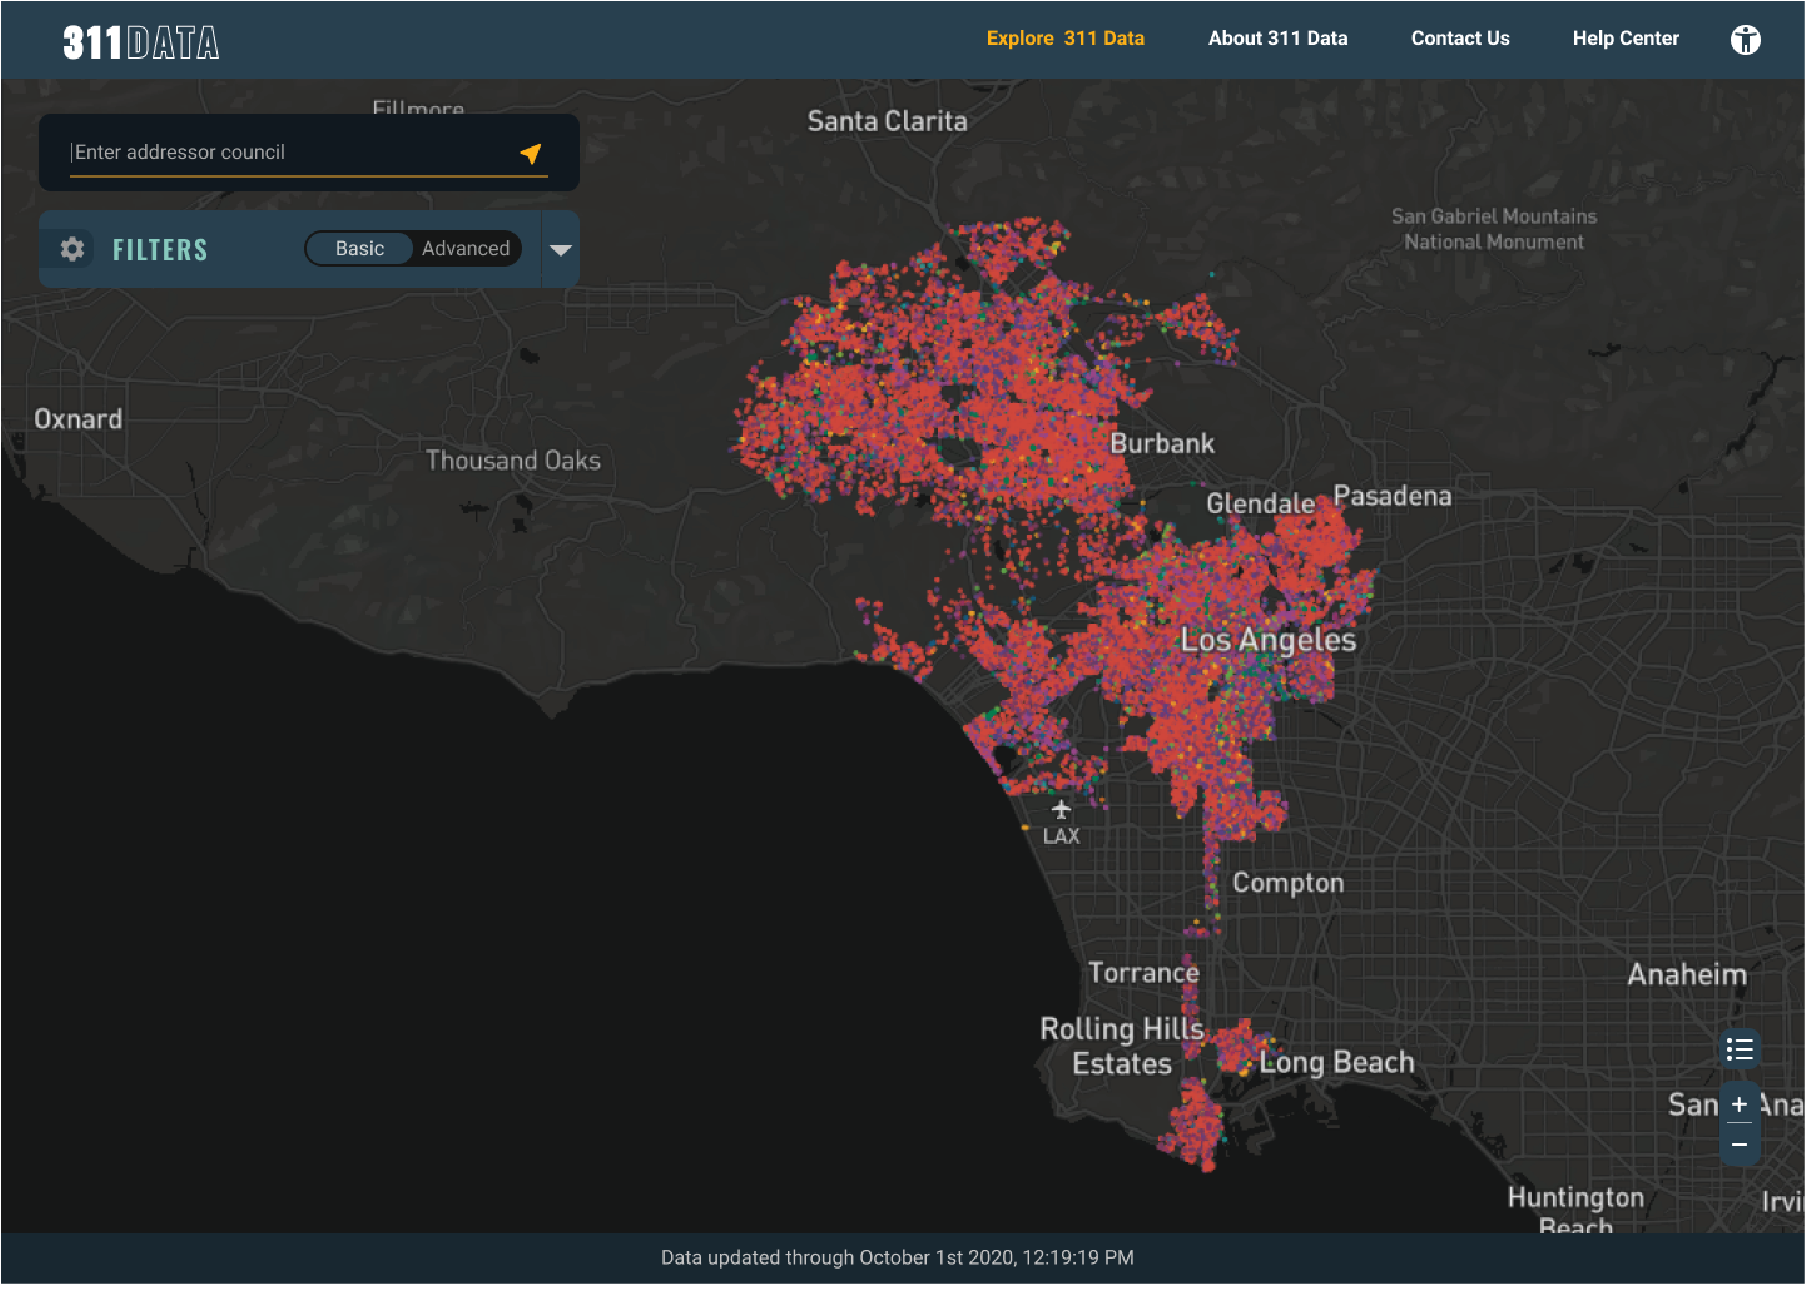
Original 311 Data Tool Vs. Redesign
Final Design: Basic vs.
Advance Features
Once expanded, the filter bar also allows users to filter for 311 Data types and to toggle between basic and advanced features. Advanced features now include charts, graphs, the comparison feature, and more data filter options.


311 Data Tool advance features
Final Design Mobile
The final design is also mobile friendly. The input field was placed at the top for users to see easily. The filter bar was placed as a sliding card on the bottom to allow for a less obstructive view of the map.

Project Credit:
Kevin Perez (UX Designer): Review Mixpanel Analytics, Hotjar Observations, User Testing, Brainstorming & Design Studio, Data Tool Mockups and Prototyping
Dana Chen (UX Designer): Review Hotjar Observations, User Testing, Brainstorming & Design Studio, Data Tool Mockups and Prototyping
Selena Jiang (UX Designer): Review Hotjar Observations, Data Tool Mockups and Prototyping
Yuenyi Lam (UX Designer): Review Hotjar Observations, Data Tool Mockups and Prototyping
John Ritchey (Product Manager): Brainstorming & Design Studio
Adam Kendis (Developer Lead): Brainstorming & Design Studio
Pras (Product Manager): Brainstorming & Design Studio